
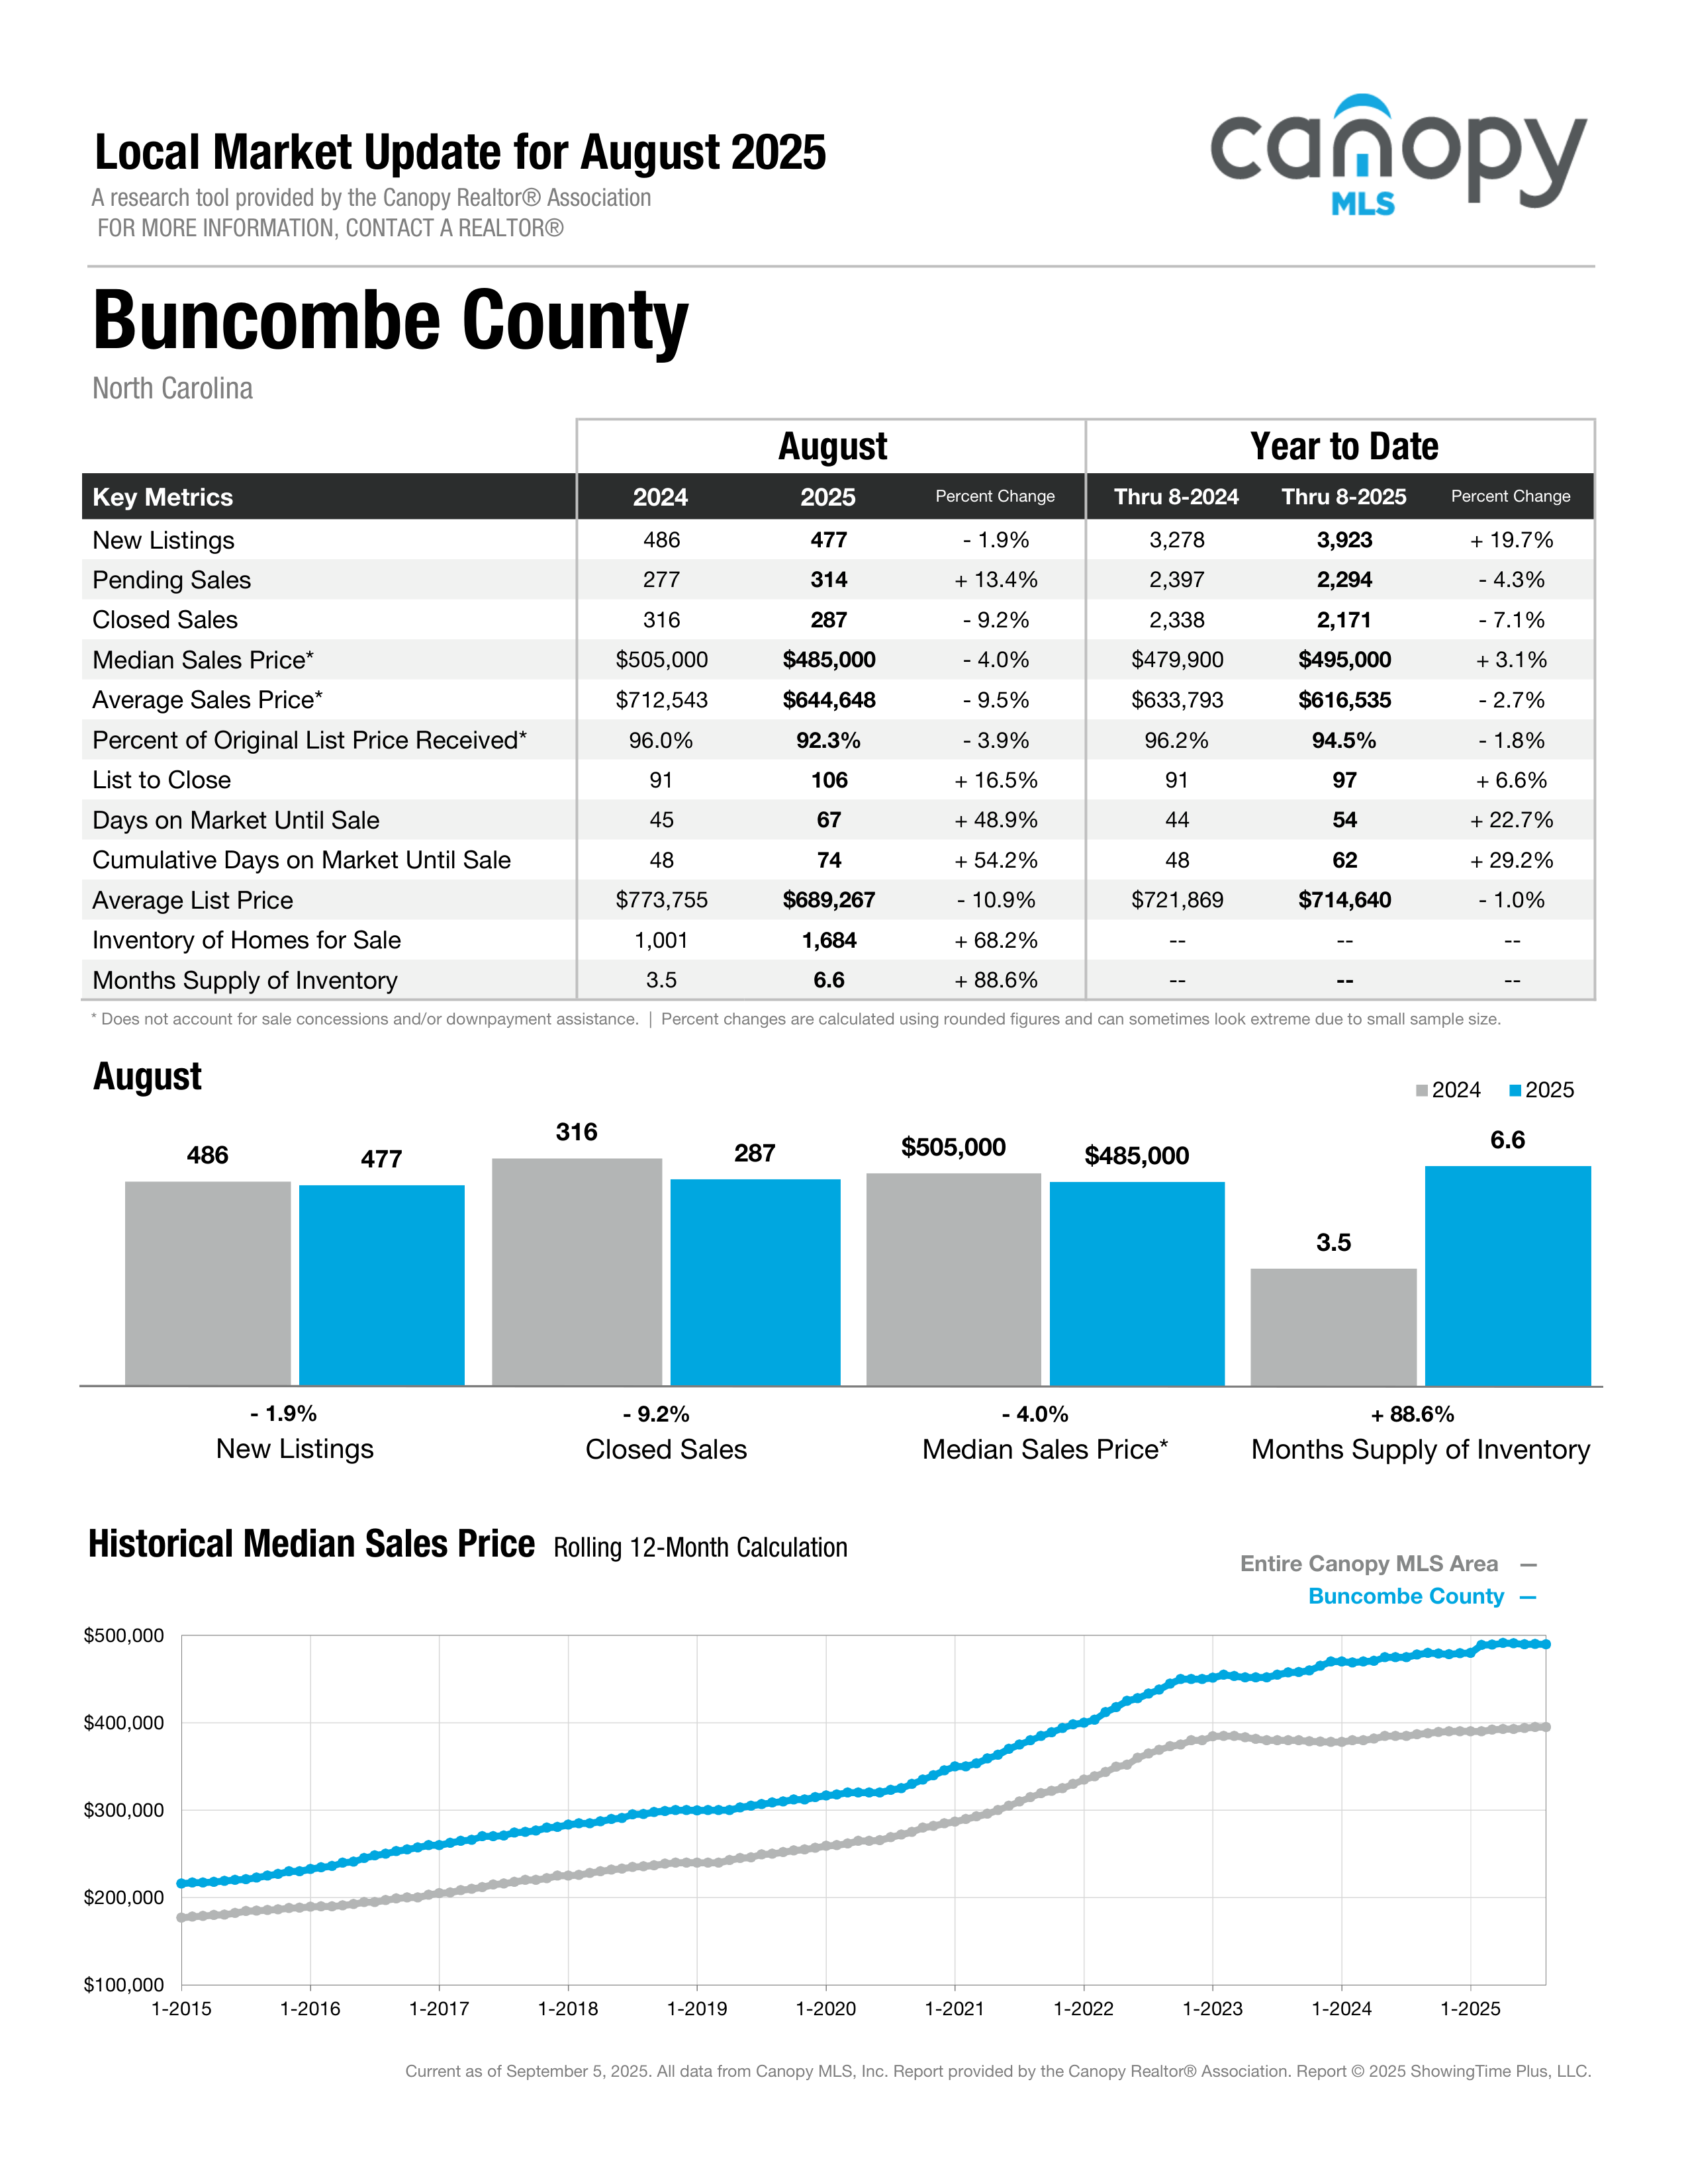
The Buncombe County housing market continued to shift in August 2025, showing a mix of opportunities for buyers and challenges for sellers. Let’s take a closer look at the latest numbers and what they mean for our local market.
New Listings & Inventory
-
New Listings dipped slightly, down 1.9% compared to last August (477 vs. 486).
-
However, year-to-date, new listings are up nearly 20%, giving buyers more choices than in recent years.
-
Inventory of Homes for Sale jumped 68.2% compared to last year, and the months supply of inventory rose from 3.5 to 6.6 months—a sign the market is moving toward more balance after years of tight supply.
Pending & Closed Sales
-
Pending Sales rose 13.4% year-over-year in August, showing stronger buyer activity compared to last summer.
-
Closed Sales, however, dropped 9.2% year-over-year and are down 7.1% year-to-date, pointing to some softening in overall transaction volume.
Home Prices
-
The Median Sales Price in August dipped 4.0% from last year ($485,000 vs. $505,000).
-
Year-to-date, though, prices remain up 3.1%, showing longer-term stability.
-
The Average Sales Price fell nearly 9.5% year-over-year, suggesting buyers are finding more options at lower price points.
Market Speed
-
Homes are taking longer to sell.
-
Days on Market increased 48.9%, averaging 67 days compared to 45 last year.
-
Cumulative Days on Market also jumped, up 54.2% to 74 days.
-
-
Sellers are receiving 92.3% of their original list price, down from 96.0% last August.
What This Means
-
For Buyers: Increased inventory and slower market pace create more room to negotiate and more options to choose from.
-
For Sellers: Pricing competitively is more important than ever, as buyers now have more leverage and patience in their home search.
-
For the Market Overall: After years of tight supply and fast-moving sales, Buncombe County is shifting into a more balanced market where both buyers and sellers need to adjust strategies.